SSC has written on cost disease. Essentially, a lot of important goods and services (health care, education, infrastructure, and housing) have increased by up to 10x their cost with no improvements in service for no discernible reason. He gave some though to it, and a number of others provided explanations.
The explanation that immediately sticks out of course is government over-regulation and over-involvement, as those industries listed are some of the more heavily regulated industries in the US. I’ve written of factors effecting housing costs a few times before.
I think those have a decent amount to do with it, but I think there are two fundamental problems that no one in those posts mentioned. They relate to two principles you’ve probably heard before: the Pareto principle and the iron law of bureaucracy.
****
Pareto Principle
The PP, also known as the 80/20 rule, is a basic rule of thumb essentially stating that 80% of the results come from 20% of the causes. Ex: 80% of the work is done by 20% of the workers. Following from this rule, you can also mathematically determine other rules. 20% of the 20% is going to cause 80% of the 80%; in other words, 64% of the outcome will come from 4% of the cause. This can then be extended to 51% of the outcome will be caused by 1%, and so on down the line. The rule’s not perfect and shouldn’t be taken as gospel, but it’s a nice rule of thumb.
In this particular case of cost disease, we’ll apply the PP to costs. By the PP, 20% of the population causes 80% of the costs. Or stated elsewise, the 20% uses 4x as much resources as the 80%.
So what happens when you add a new 20%?
For example, health care. I, like most people reading this, cost the health care system very little. I’ve been to the emergency room twice in in my adult life, and I go to a walk-in doctor about once every 2 years when I have a particularly vicious or inexplicable pain or cough. The 80% of the people like us can be treated relatively low cost; we get an occasional check-up and the rare emergency.
On the other hand, there are those with chronic illness or other conditions who use more health care in a month or two than I’ve used in the last decade. 20% of the people cost 80% of the health care resources. That’s not an indictment on the 20% (if I got hit by a bus on the way home today, I’d probably be in that 20%), but it’s undeniable that if us 80% simply stopped caring about the 20% and just let them suffer and die, health care costs would be 20% of what they are now.
Over time we’ve been going increasingly towards being able to treat more health problems and keep the nearly dead alive longer. Take AIDS: in the 80’s someone with AIDS was dead in a months. Now, he can be kept alive for decades using expensive drug cocktails.
So, let’s put some very rough numbers to it.* Let’s say 20% of that 20% (4%) used to just die quickly, because we couldn’t treat them. So, we have the 80%, the 16%, and the 4%. The 80% still can be treated; we cost stay the same. The 16% still use 4x the amount of resources the 80% use; a broken pelvis doesn’t treat itself. But now the 4% of AIDS patients and the like can be kept alive through expensive new technologies. This 4% is now 64% of the budget, which the budget has grown to accommodate. Keeping 4% people alive has well over doubled the costs of health care.
Now wait an unspecified amount of time for expensive new technologies and drugs that can treat a new 20% of the 4%who couldn’t previously be treated. Costs double again. Then another unspecified time later they double again and so on.
But that’s not including the new costs you impose. We 80% used to go to the ER once a decade and the doctor once a year, then die in our sleep from a heart attack at 70. But now, instead of dying at home in bed, new technologies and new detection we are able to detect and prevent that heart attack, so now we are heroically rescued by new medical technology, so we can die a decade or two later from a different age related condition. Then when our alloted time is over, instead of just giving up the ghost, we keep ourselves alive at great cost for a few extra months. We are now the 20%, maybe even the 4%.
This is not just hyperbole: 30% of Medicare spending goes to just 5% of people who will die within the year. 10% of Medicare goes to those people’s last month of life. Those extra few months are costly.
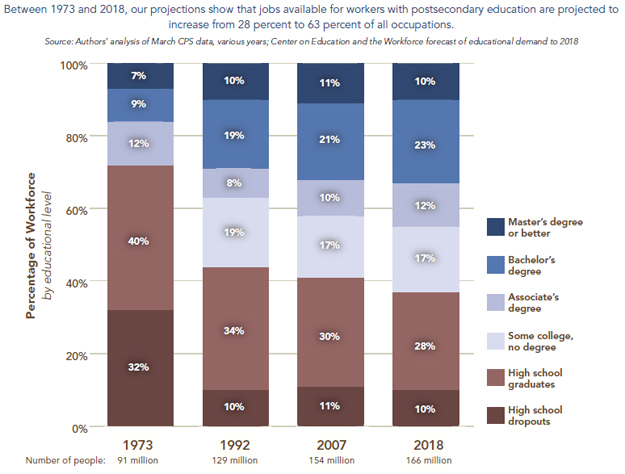
For education, we get the same thing. Look at this chart:

In 1973, 30% of people dropped out in high school. It’s safe to assume these are mostly the hardest and most expensive to educate 30%, they’re probably mostly handicapped, persistent trouble-makers, class clowns, generally stupid, or future ex-cons. In 2018, only 10% dropped out. So, rounding the PP off widely for ease, 70% of the students using 20% of the resources, 20% of the students using 80%, with 10% still dropped out. So you’ve added 20 percentage points of troublesome and costly students which have increased the amount of resources used by 4x.
The 10% left are the real costly troublemakers, these are the ones that are dumb as bricks, violent offenders, hate school with a passion, have hourly seizures, or whatever. So, if we start to include these very troublesome students, the will be the new 4%, and increase costs even more. The more stupid and disruptive the people we try to force to stay in school, and the longer we force them to stay there, the more costs per pupil inflate. If the education for everyone doesn’t stop, eventually, we’ll be spending half the education budget keeping 100 psychotic mass-murdering teenagers and low-functioning autists who enjoy biting teachers in a Supermax high school from killing each other and trying to learn their times tables.
College is no different. I’ve looked at the tuition bubble before, but let’s briefly go over it again. Look at that chart again: in 1973 only 28% of people had a degree, there were statistically no college dropouts. in 2018, 45% will have a degree and 17% will dropout. The college keeps adding new 20%’s. The 28% getting degrees in 1973 were, likely, the top 30% of the population in terms of intelligence and/or work ethic. They didn’t require much resources to teach themselves. Now 60% of people are going to college. People with below average intelligence and work ethic are having to be accommodated. A new 20% has been at least 3 times since 1973. Using the PP we can estimate costs would have risen by over 50x. Now, this is not entirely accurate, there are likely costs savings due to scale and at the most expensive of those waves mostly drops out, but you get the point.
Let’s look at infrastructure. Here’s a story I randomly saw from Toronto. Sidewalk spaces are being expanded to 2.1m at the costs of restaurant patios to accommodate the disabled. On the TV report I saw, they said it was because 2.1 meters allowed two motorized wheelchairs to pass each other. Again, the PP. It costs a lot for infrastructure to service the small fraction of people who are handicapped. It costs even more to service the rare event of two handicapped trying to pass each other at the same time (I can’t ever remember seeing two motorized wheelchairs at the same time in the wild). And one councilor is demanding even wider sidewalks for more accommodation. That’s a lot of extra cost for both the city for such a rare event.
Apply this one minor story more broadly. Beyond, the disabled, there’s the environmentalists, special interest groups, NIMBY, safety. You have to accommodate more and more people and more and more exceptions.
Now, almost everybody is and always has been housed, so PP doesn’t really apply there. Cost increases are more likely related to the factors I linked to earlier. You’ll also notice that housing costs did not grow at as high a pace as other costs in Scott’s post.
Over time these major services have gotten more inclusive. These new people being included cost significantly more resources than the people who were already included. By the 80/20 rule, ever new 20% we add quadruples costs. Every new 4% we add, almost doubles costs.
For the large majority of people, services haven’t improved at all, even though costs have skyrocketed, because these costs are being eaten by the inclusion of ever smaller but ever-more resource-consuming minorities.
****
Iron Law of Bureaucracy
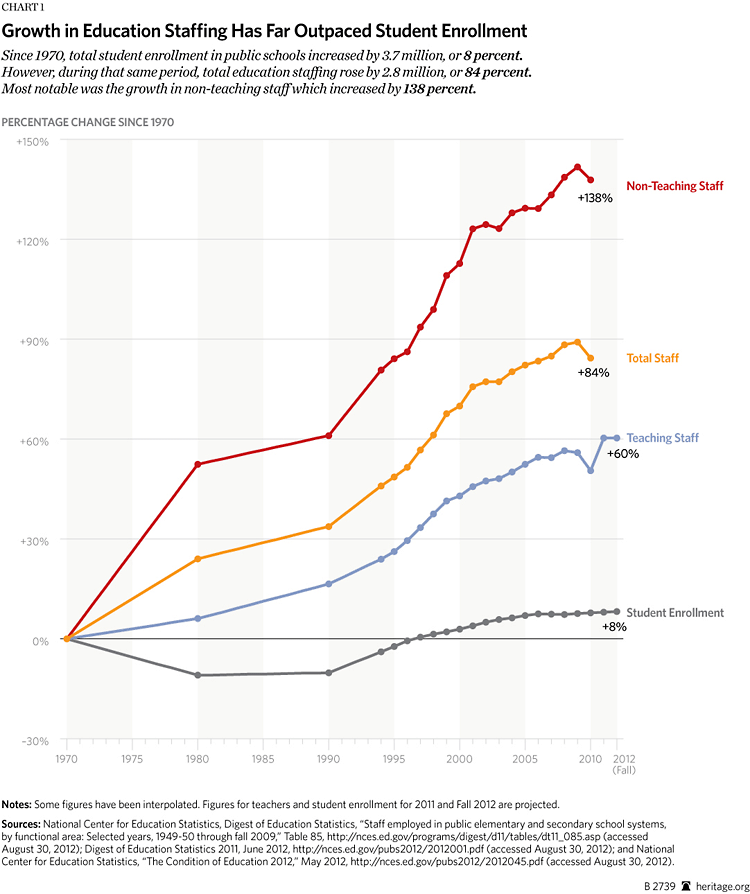
One commenter linked to the following graph:

The ILB states that there are two types of people in every organization: the first is devoted to the organization’s goals, while the second is devoted to the organization itself. The second will always end up controlling the organization and it resources.
Look at the chart, it is clear the administrators control the organization and hiring and are hiring more of their own. It’s the ILB in action: the teachers directly contribute to the organizational goal of teaching, but the administrators are the one’s profiting themselves.
The ILB is what is a major part of cost disease. Over time any organization becomes more about expanding the organization than about completing its goals. The free market to some degree mitigates this, as organizations suffering too heavily under the iron law are forced to either reform or die out. But the organizations controlling education, health care, and infrastructure are not traditional free market organizations. They are either government organizations or heavily regulated, government-financed organizations.
Unless an organization dies or is forced to reform, it will inevitably become controlled by those devoted to enriching the organization and themselves, rather than to completing its goals.
Infrastructure provides a nice example. Look at the Big Inch pipeline built in 1944 and extending from Texas to New Jersey. At that time, government infrastructure programs were controlled by people dedicated to providing infrastructure. It took 3 years from planning to completion, because they wanted it up.
Comapre to the Keystone XL, controlled by our new iron-lawed infrastructure regulators dedicated to expanding their organization. It was proposed in 2008 and after 7 years in bureaucratic hell, was rejected by Obama. Then was allowed to start again under Trump a couple weeks ago. It has become more about increasing the power of hanger-on organizations than actually getting things done. Placating environmentalists, native activists, NIMBYists, labour organizations, etc. and making sure each gets their turn at looting is more important than actually creating infrastructure.
I don’t really think I have to explain this too deeply, anyone who’s ever worked in a large organization can easily see there is a small minority of people actually physically accomplishing the organization’s goals, then there are hoards of people having meetings, making mission statements, discussing work-life balance, running committees, making HR rules, doing busywork, playing corporate politics, doing pointless revisions to act like their contributing, and otherwise not actually accomplishing anything real, or sometimes even actively preventing the accomplishment of goals.
As people dedicated to expanding the organizations (and their own personal power bases) become more powerful, it becomes more costly to do the same amount of work. All those extra people don’t pay themselves.
****
* I know there’s mathematical and logical flaws and over-simplifications throughout these examples, but they’re just quick calculations for illustrative purposes. I’m dealing with a rule of thumb, not a mathematically precise model. Don’t get lost in the numbers, get the general jist of the message.